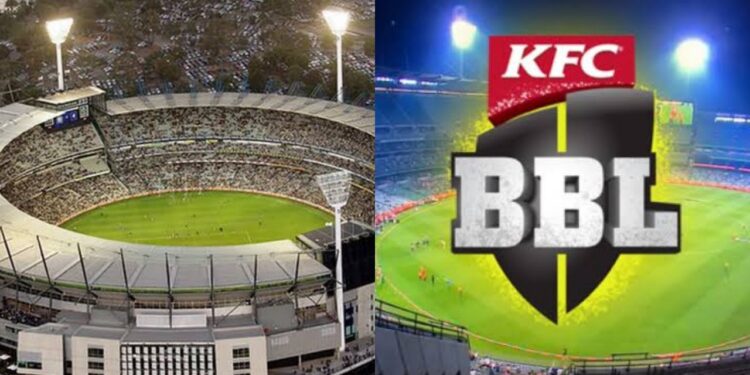
On Friday, Melbourne Stars are going to host Hobart Hurricanes in a BBL match. It’s the 4th game of the ongoing season and the Stars are already set to play their 2nd game. The game is scheduled to play in Melbourne Cricket Ground and meanwhile, fantasy players are looking for the pitch report and T20 records at MCG. In this space, you will get to know the stats of matches played in the Iconic Stadium which you may find helpful.
MCG is the second oldest ground in Australia after the Sydney Cricket Ground. It has the capacity to allow 100000 spectators to watch the game at once which makes it the biggest stadium in the country. Cricket is being played here since 1854 and it also hosts other sports such as Rugby and Football.
Melbourne Cricket Ground Pitch Report for BBL 2022-23
MCG has a bouncy pitch so, if pacers bowl at a good line and length, batters tend to struggle here. However, the ball comes nicely on the bat. Usually, chasing a total is considered safe on this surface. Out of 18 complete international T20 games, 11 times batting the second team has won here. You rarely see spinners leaving impact at Melbourne Cricket Ground but due to big boundaries here batters usually lose wickets against spinners while trying to clear the rope.
The average first innings total at MCG is 142 as far as international cricket is concerned. But in recent BBL games, the average total has been 155 here.
In 2022 T20 World Cup, a total 7 games including the final were scheduled to play here. However, 3 games were completely washed by rain. The infamous India vs Pakistan game was also played at Melbourne Cricket Ground’s pitch in which India won the game in last ball thanks to a thumping knock from Virat Kohli. In 4 completed games, 2 were won by team batting first while 2 by chasing side.
ALSO READ: Cazaly’s Stadium Cairns Pitch Report for BBL 2022-23 & T20 Records
MCG T20 International Records
- Total Matches: 19
- Matches won by the team batting first: 7
- Matches won by the team batting second: 11
- No result: 1
- Highest team score while batting first: India – 184/3 vs Australia (2016)
- Highest team score while batting second (in defeat): Australia – 157/8 when chasing India’s 184 (2016)
- Lowest team score while batting first: India – 74/10 vs Australia (2010)
- Lowest team score while batting second (in defeat): Australia -119/3 when chasing Sri Lanka’s 161 (2013)
- Biggest total chased: Sri Lanka chased Australia’s 168 (2017)
- Lowest Total Defended: Australia defended 127 vs Pakistan (2010)
- Melbourne Cricket Ground’s average first innings score in T20I: 142
- Best bowling figures for a spinner: David Hussey – 3/25 vs South Africa (2009)
- Best bowling figures for a pacer: Josh Hazlewood – 4/30 vs England (2014)
- Highest individual score: David Warner – 89(43) vs South Africa (2009)


